
WooCommerce Analytics Guide: Increase Sales with Smart Data Insights
In the dynamic world of online commerce, running a successful store means more than just listing products. It requires a deep understanding of what truly makes your customers tick, what products are flying off the digital shelves, and where your marketing efforts are making the biggest splash.
For many business owners, the word “analytics” can conjure images of complex spreadsheets and technical jargon. However, for WooCommerce entrepreneurs, business affiliates, and casual readers alike, understanding your store’s data is far from a scary monster; it is the backbone of online success.
WooCommerce, powering an impressive 34% of all online stores worldwide and nearly 5 million websites globally, offers powerful built-in analytics capabilities. These tools transform raw numbers into actionable insights, helping businesses shift from reactive guesswork to proactive, data-powered decisions that drive growth. Think of it as your store’s secret weapon, revealing what is truly working and what needs a little nudge to perform better.
This article will demystify WooCommerce Analytics, breaking down its core reports into easy-to-understand concepts. It will show how these numbers can be leveraged to make smarter, more informed decisions that directly lead to increased sales and happier, more loyal customers.
WooCommerce Analytics Demystified: Your Go-To Reports for Growth

WooCommerce Analytics is a powerful, built-in reporting system accessible directly within the WordPress dashboard. It is designed to visualize sales and customer data using intuitive charts and tables, providing a comprehensive view of a store’s performance. This system offers nine distinct reports, complemented by advanced filtering and segmenting tools, allowing business owners to dive deep into their operational data.
Its core purpose is to provide a clear view of every step in the buying process, making it easy to spot problems and opportunities right away. This means less time guessing and more time making informed choices.
Your Money Map: Sales & Revenue Reports

The “Overview” section offers a quick glance at essential metrics such as total sales, net sales, the number of orders, and products and variations sold over a chosen period. The “Performance” section expands on this, detailing total sales, net sales, orders, products sold, and variations sold. Users can select various date ranges, from “last week” to “last year,” and even compare performance against previous periods or years, providing a historical context for current trends.
To truly understand the financial health of an online store, it is important to grasp these key metrics:
- Total Sales: This represents the store’s overall top-line revenue, encompassing the sale price of products multiplied by the quantity ordered, and includes taxes and shipping, after accounting for any returns and coupons. It provides the big picture of the money flowing into the store.
- Net Sales: This is a more accurate measure of profitability, representing the true revenue after all discounts and returns have been subtracted from gross sales. It reveals what the store has genuinely earned.
- Average Order Value (AOV): This metric indicates the average amount customers spend each time they place an order. A higher AOV signifies more revenue generated from each customer interaction, indicating successful upselling or cross-selling efforts.
- Returns: This metric quantifies the value of products customers have sent back. A high return rate can significantly eat into profits and may signal underlying issues.
- Coupons: This tracks the impact and usage of discount codes and promotional offers. It helps determine if promotions are effectively driving sales or merely reducing profit margins.
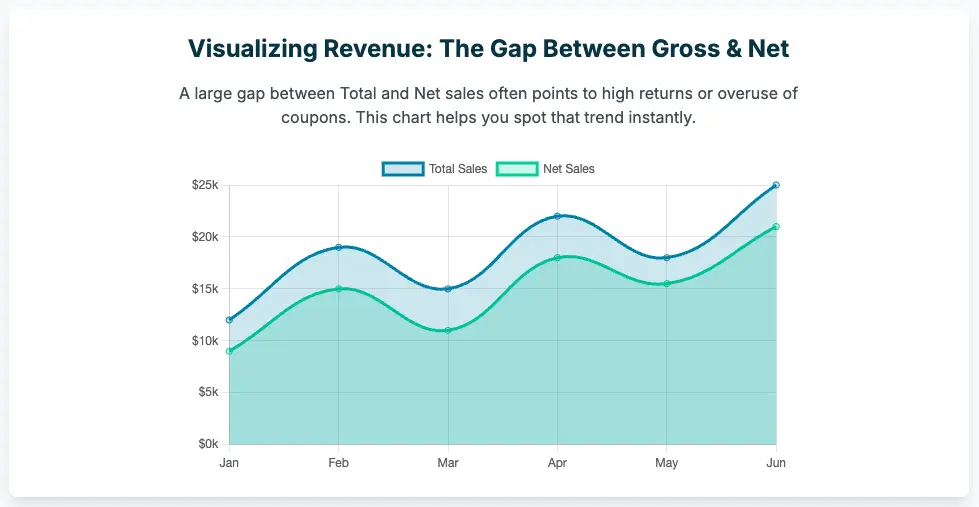
These reports are essential for monitoring revenue trends and accurate sales over time. They help a business owner ascertain whether their store is growing, shrinking, or maintaining a steady pace. A critical aspect of using these reports effectively is recognizing their interconnectedness.
For example, if a business owner observes that their “Net Sales” are lower than expected, a surface-level glance might not reveal the root cause. However, by examining the same “Revenue” report, they can investigate the “Returns” and “Coupons” data. If returns are unusually high, or if a significant number of discounts have been applied, these could be direct explanations for the reduced net sales.
This observation then leads to a deeper inquiry: which products are being returned most often, or which coupons are being heavily utilized? This directs the owner to the “Products” report to identify specific items with high return rates. From there, they might consult the “Orders” report to see if there is a pattern in the “Order Status” (e.g., many “refunded” orders for a particular item) or “Customer type” (e.g., new customers returning it more frequently than returning ones).
This diagnostic pathway demonstrates that a business owner should not view individual reports in isolation. Instead, they should understand how metrics across different reports act as clues, guiding them to the root cause of issues or opportunities. This interconnectedness allows for precise, rather than generalized, business improvements. For instance, if net sales are consistently lower than total sales, it is a clear indicator to investigate returns and coupon data.
High returns might suggest product quality issues or misleading descriptions, while high coupon usage with low profit margins could mean over-discounting. This detailed examination empowers businesses to refine their pricing and promotional strategies for better profitability.
Product Power-Up: Knowing What Sells (and What Doesn’t)
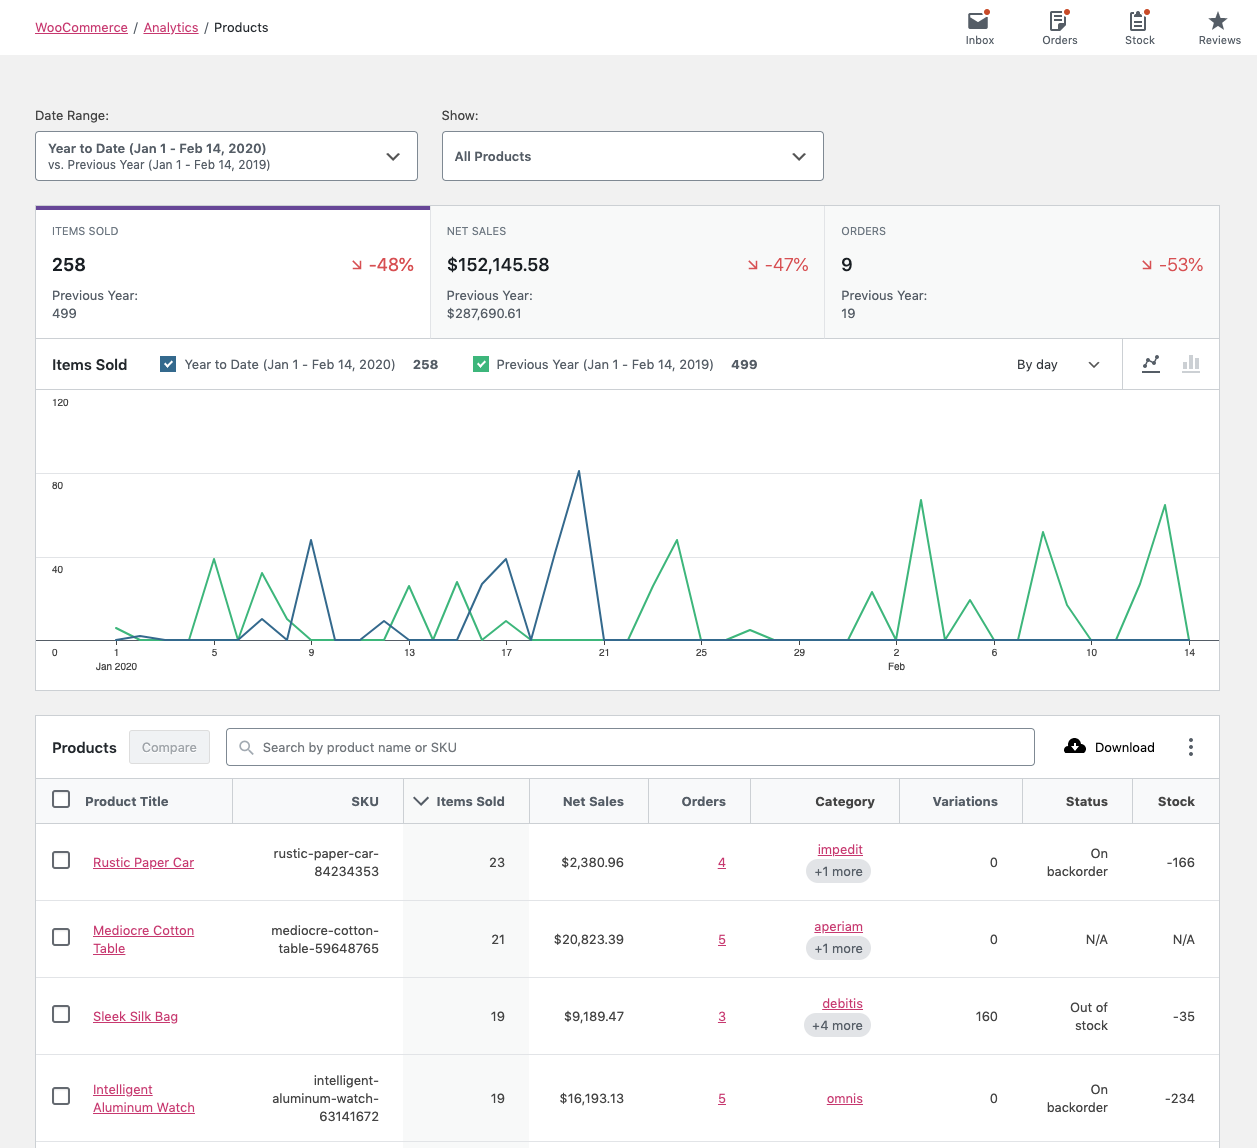
The “Products” report is a crucial tool for understanding the performance of individual items in a store. It helps track key statistics such as “Items Sold, Net Sales, and Orders“. This report offers the flexibility to view data for “All products,” a “Single Product,” or “Comparison data,” enabling a zoomed-in perspective on specific items or a comparative analysis of their performance.
Understanding these product-level numbers is essential for making informed decisions:
- Items Sold: This metric directly indicates the quantity of each product sold, serving as a clear measure of its popularity. By identifying top-selling products, businesses can focus marketing efforts on these superstars, ensure sufficient stock to meet demand, and explore opportunities to create bundles or recommend related products. Conversely, products with consistently low sales might warrant a re-evaluation of their pricing, description, or images, or even consideration for discontinuation to free up resources.
- Net Sales by Product: This figure reveals the actual revenue generated from each product after accounting for discounts and returns, providing insight into its true profitability. Products with high net sales are strong revenue generators, warranting further investment, perhaps through premium marketing or inclusion in gift sets. If a product sells many units but has low net sales, it could be due to frequent heavy discounting. In such cases, re-evaluating the pricing strategy or seeking ways to reduce the cost of goods sold becomes imperative.
- Orders (Product Inclusion): This metric shows how many orders each product was included in. Products frequently added to orders, even if their individual value is low (like a reusable shopping bag), present excellent opportunities for cross-selling or up-selling. They can be prominently displayed as suggested add-ons during checkout, or a small discount might be offered when bundled with other items. For new products with low order counts, increasing their visibility on the homepage or featuring them in email campaigns can significantly boost exposure.
The ability to filter by various date ranges, compare different periods, and drill down into specific products, categories, or variations offers the granularity necessary for effective action. This precision allows a business owner to move beyond simply knowing “what happened” to understanding “where and when it happened,” enabling highly targeted interventions.
For instance, instead of launching a generic store-wide promotion, a business can use this detailed data to target a specific product that is struggling or adjust its marketing strategy for a particular seasonal period when sales typically dip. This approach prevents wasted effort on broad initiatives when a more surgical, data-driven approach is available.
Understanding Your Customers: The Heartbeat of Your Business

Customers are the lifeblood of any online store. Understanding their behavior, preferences, and loyalty is paramount for sustainable growth. WooCommerce Analytics provides powerful tools to gain these crucial insights.
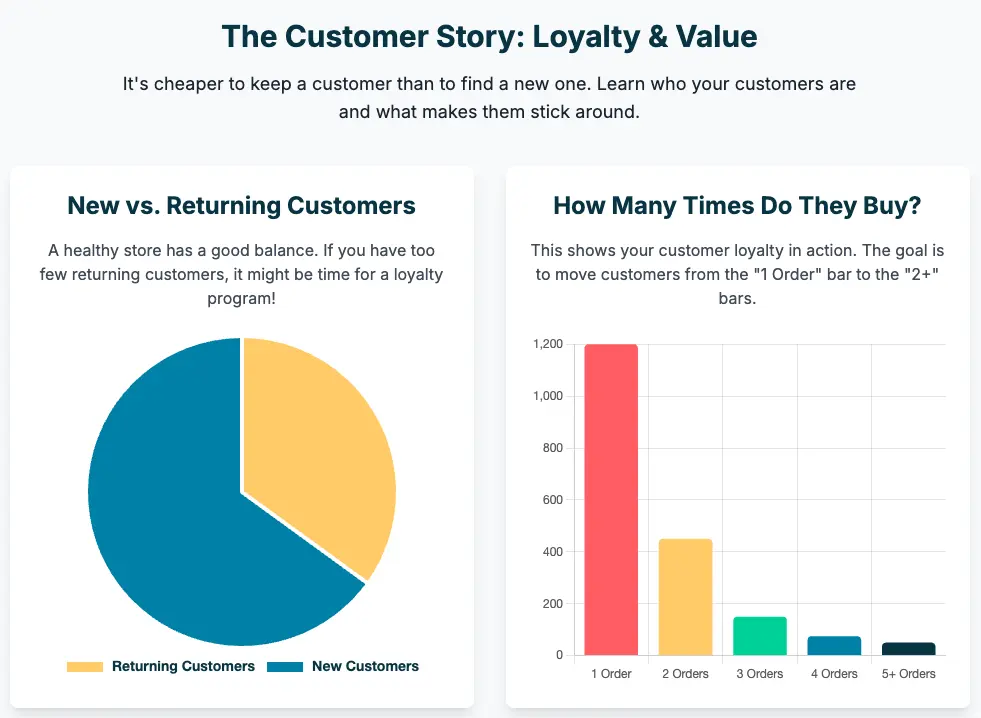
Who Are Your Customers? New vs. Returning
The “New vs. Returning Customers Report” is a vital tool for tracking customer acquisition and retention trends. This report distinguishes between customers making their first purchase and those who have bought from the store before, offering a clear picture of customer loyalty.
- Driving Customer Retention: By analyzing trends in returning customers, businesses can identify periods or campaigns that successfully encourage repeat purchases. A decline in returning customers might signal a need to re-evaluate customer loyalty programs, post-purchase follow-ups, or product satisfaction. For example, if the report shows a drop in returning customers after a specific product launch, investigating potential issues with that product or its marketing could reveal reasons for reduced repeat business. Conversely, if a particular marketing campaign led to a significant increase in returning customers, replicating or expanding on that campaign can be highly beneficial. The report’s ability to distinguish between new and returning customers helps businesses understand the sustainability of their growth. A high rate of new customers without corresponding retention suggests a “leaky bucket” scenario, requiring different strategies than a business with strong customer loyalty but slow acquisition. This data helps prioritize efforts for long-term health and stability.
- Boosting Sales: Understanding the proportion of new versus returning customers aids in allocating marketing resources effectively. If a store attracts a high percentage of new customers but has a low retention rate, the focus should shift to converting those new customers into loyal, repeat buyers. This could involve targeted email campaigns offering discounts on their second purchase, personalized product recommendations based on their first order, or exclusive content for first-time buyers. For instance, if a specific ad campaign leads to a surge in new customers, implementing a follow-up email sequence designed to nurture these new leads and encourage their next purchase becomes a logical next step.
Optimizing Your Marketing & Operations: Beyond the Numbers
Beyond understanding sales and customer loyalty, WooCommerce Analytics provides powerful tools to refine marketing strategies and streamline operations, ensuring every effort contributes to increased sales.
Streamlining Your Store: Orders & Inventory
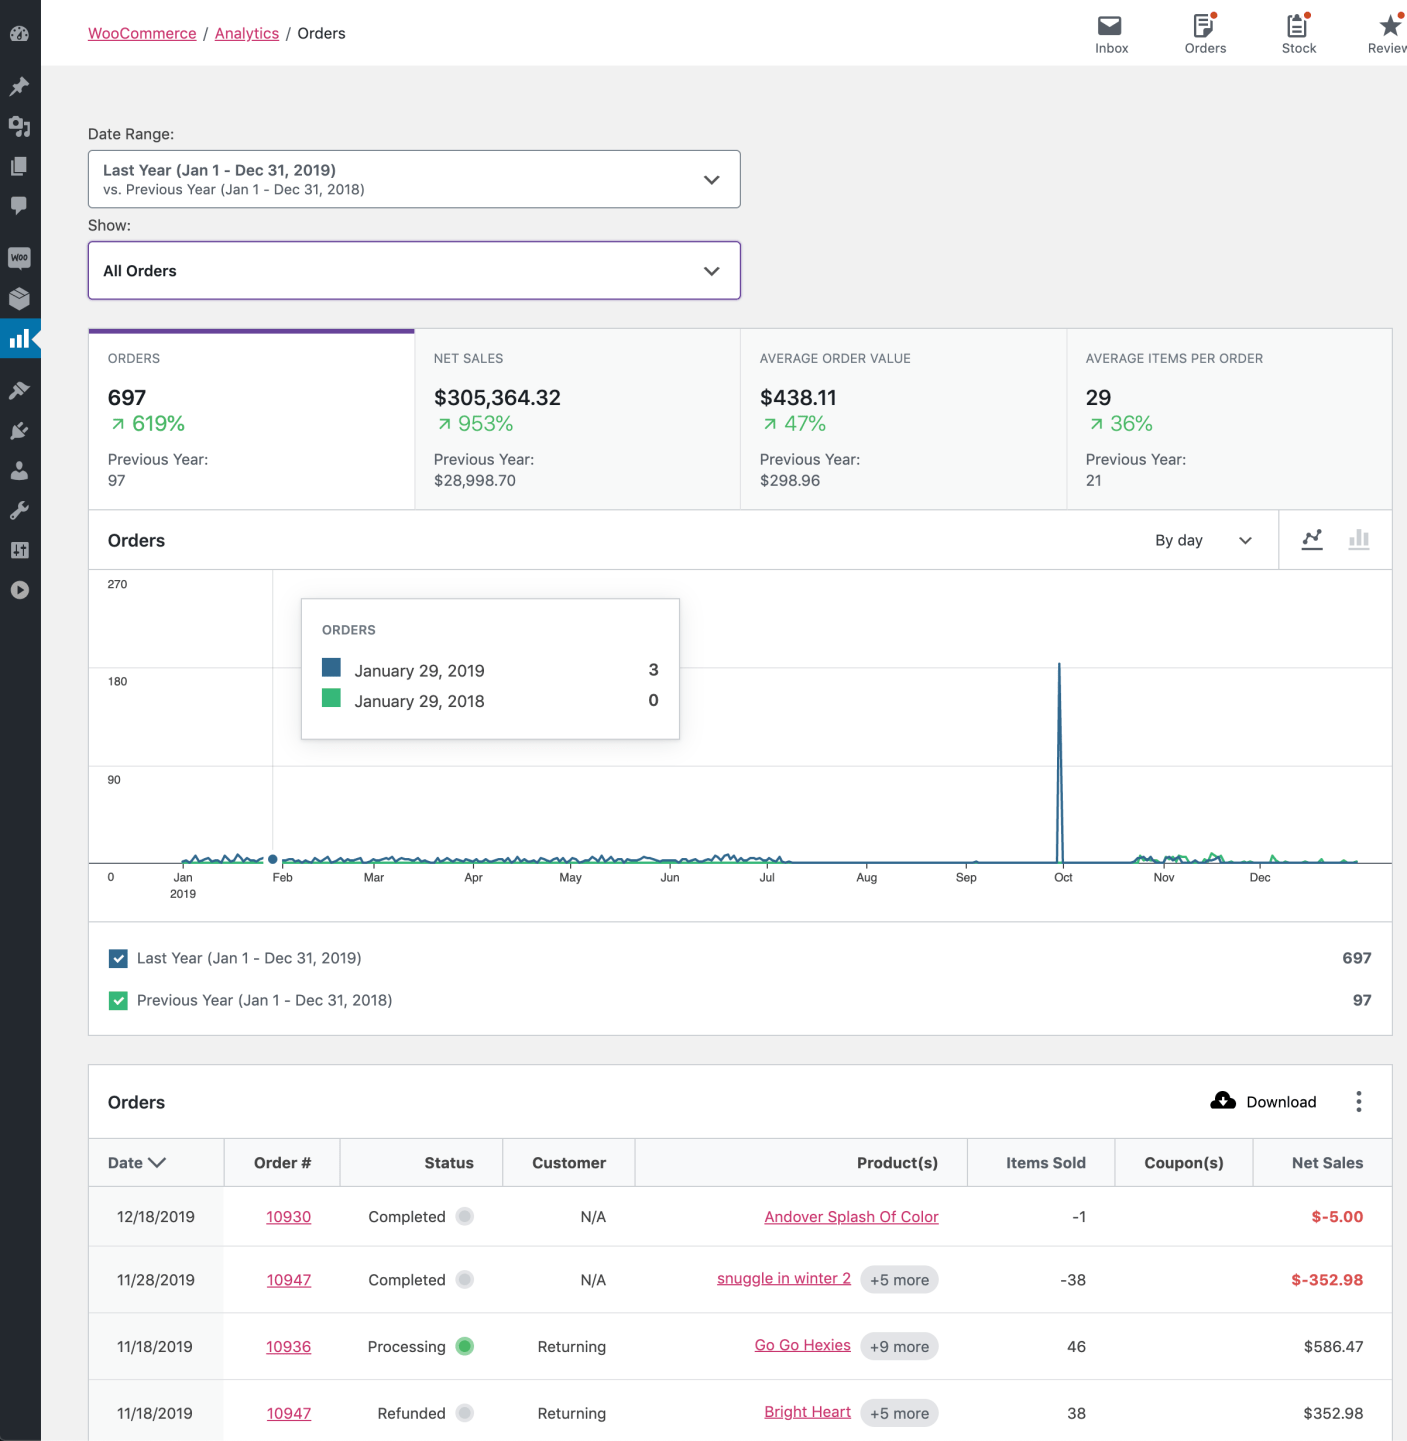
The “Orders” report in WooCommerce Analytics provides detailed data on order status, customer type, and items sold. This information is invaluable for improving order fulfillment and enhancing the overall customer experience, which directly contributes to increased sales.
- Optimizing Order Fulfillment: Analyzing the distribution of orders across different statuses (e.g., pending, processing, completed, on-hold, cancelled, refunded) helps identify bottlenecks in the fulfillment process. A high number of “Pending” or “On-Hold” orders might indicate issues with payment processing or stock availability, which, if addressed promptly, can reduce delays and improve satisfaction. Frequent “Cancelled” or “Refunded” orders warrant investigation into product quality, slow shipping, or poor communication to identify areas for improvement.
- Efficient Inventory Management: The “Items sold” data, combined with product information, is crucial for understanding product popularity and managing inventory. Identifying top-selling items ensures adequate stock levels, preventing lost sales due to stockouts. Conversely, data on underperforming products can prompt investigations into descriptions, pricing, or even discontinuation. The ability to link order status to customer types and specific products allows for a holistic view of operational bottlenecks. For instance, if “Pending” orders are high only for new customers buying a specific product, it suggests a unique onboarding or product description issue, rather than a general payment gateway problem. This level of detail enables targeted operational improvements.
Turning Data into Dollars: Real-World Impact & Actionable Steps

The true power of WooCommerce Analytics lies in its ability to transform raw data into actionable strategies that directly impact sales. Many successful businesses, from small shops to large enterprises, leverage data to thrive. The principles behind large-scale successes, such as Amazon’s dynamic pricing, Netflix’s content recommendations, or Walmart’s inventory optimization, are equally applicable to smaller WooCommerce stores.
One impactful application is predictive upselling, where analyzing past customer behavior and transaction history allows businesses to suggest products that are most likely to be purchased together. This technique has led to significant increases in Average Order Value (AOV) and conversion rates.
For instance, a fashion retailer using predictive upselling saw a 25% increase in AOV by recommending complementary accessories, shoes, and handbags to customers already shopping for clothing. Similarly, an electronics store achieved a 30% increase in sales by suggesting tech accessories alongside core products like phones.
Here is an action plan for making WooCommerce Analytics work for any business:
- Define Clear Goals and Key Performance Indicators (KPIs): Before diving into data, it is crucial to identify what truly matters for the business. Goals might include increasing online sales, improving customer retention, or boosting average order value. Relevant KPIs to track include total revenue, AOV, conversion rates per traffic source, Customer Lifetime Value (CLV), inventory turnover rates, and campaign ROI. Focusing on these specific, measurable metrics ensures that analysis leads to impactful decisions.
- Implement Regular Review and Automation: Consistent monitoring is key. Set a schedule for weekly or monthly reviews of sales, inventory, and customer behavior reports. To save precious time and ensure real-time tracking, automate report generation and delivery. Many plugins offer scheduling features to send reports directly to an inbox.
- Optimize Your Store Based on Data:
- Product Pages: Use product performance data to update descriptions, highlight key benefits customers are looking for, and implement strategic upsells or cross-sells. If a product consistently underperforms, investigate its pricing, visibility, or reviews. We have cover how to improve your product page on this article : The Ultimate Guide to Writing High-Converting WooCommerce Product Descriptions.
- Checkout Experience: Analyze conversion funnel reports to identify drop-off points in the checkout process. Simplify steps, reduce form fields, clarify shipping options, and offer multiple payment options to reduce cart abandonment. Using urgency or scarcity tactics (e.g., “Only 3 left in stock!“) can also encourage final purchases.
- Inventory Management: Adjust stock levels based on seasonal sales trends and anticipated demand, ensuring popular products are always available and preventing overstocking of slow-moving items.
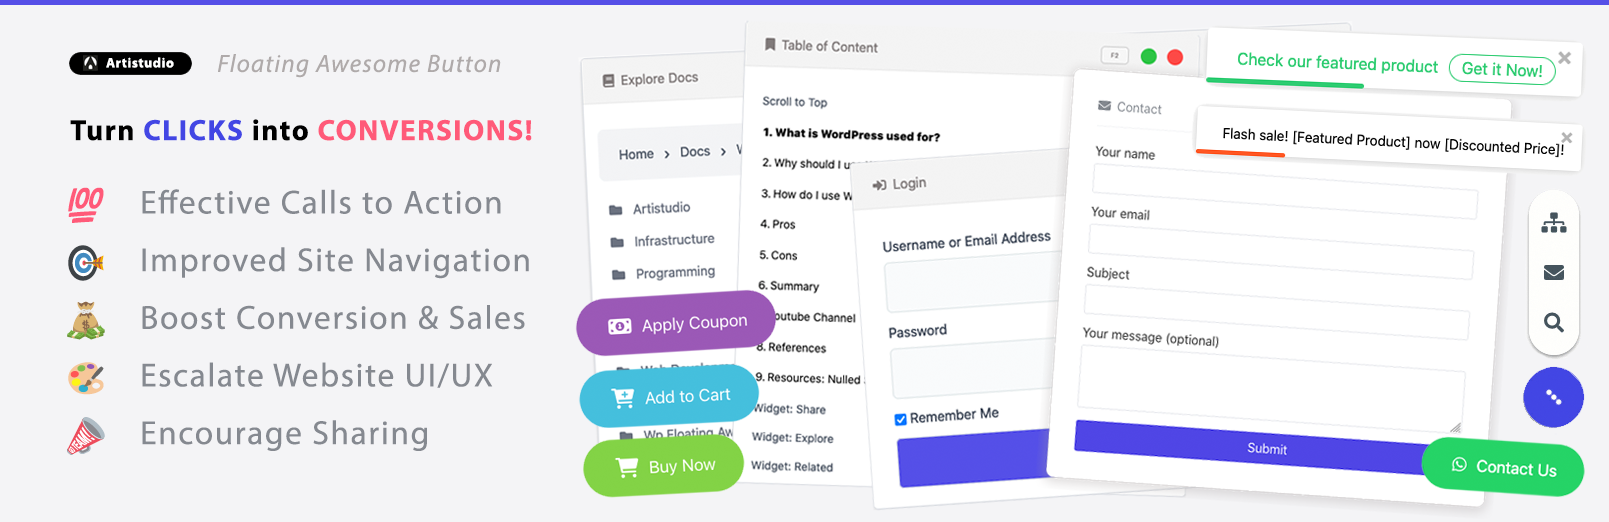
The “Floating Awesome Button” plugin serves as an invaluable tool for implementing these data-driven actions directly on a website:
- Promotions: Utilize toast notifications for timely announcements or discount popups to capture attention and drive sales.
- Product Highlighting: Easily display featured products or offer quick purchase options to streamline the shopping experience.
- Engagement: Integrate social media links, contact forms, or exit-intent popups to capture leads and grow the online community.
- User Experience: Implement sticky buttons for easy navigation and utilize device-specific filtering (Pro feature) to optimize the mobile shopping experience, ensuring seamless interaction across all devices.
WooCommerce Dashboard
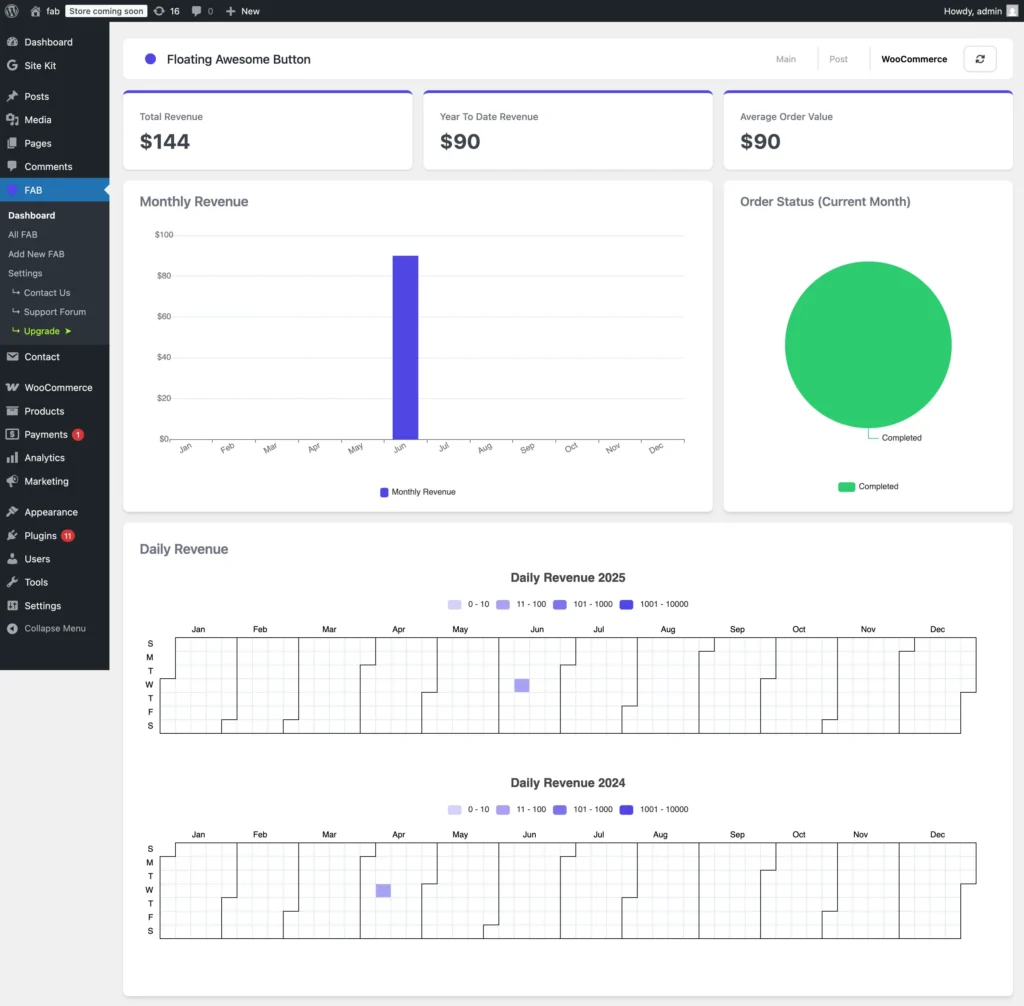
Besides that, to empower more of your data driven strategy Floating Awesome Button also comes with some additional charts, for example in FAB Dashboard you can see
Total Revenue:
- Description: This represents the total revenue generated from your WooCommerce store overall. It includes all sales across products and services, showing the cumulative amount earned.
- Benefit: Monitoring total revenue is crucial for understanding the overall success of the store. It reflects the store’s ability to generate income through sales over time.
- Data-Driven Decision: If total revenue is increasing steadily, it indicates that the business is growing. However, if there’s stagnation, you might need to refine marketing strategies, improve product offerings, or explore ways to boost sales (e.g., promotions or better-targeted ads).
Year to Date Revenue:
- Description: This shows the revenue earned from the start of the current year up until now. It provides insight into how well the business is performing in the current year compared to previous periods.
- Benefit: Year-to-date revenue helps you track progress toward annual goals, identify potential revenue shortfalls, and plan for the remaining months.
- Data-Driven Decision: If this number is below expectations, you can analyze the factors contributing to the shortfall (e.g., reduced sales, seasonal effects) and implement corrective actions. For instance, you might focus on improving marketing outreach or revising product prices for the remainder of the year.
Average Order Value:
- Description: This metric indicates the average value of each customer transaction in your WooCommerce store.
- Benefit: A higher average order value suggests that customers are purchasing more per transaction, which is an indicator of a profitable store.
- Data-Driven Decision: If the average order value is lower than desired, consider strategies like cross-selling, upselling, or offering discounts for higher-value orders. You could also experiment with product bundling to increase the overall transaction value.
Monthly Revenue:
- Description: This chart breaks down revenue by month, showing how much money was generated in each month. A notable spike, like the one in June, is highlighted here.
- Benefit: The monthly revenue graph helps identify peak months and any potential seasonality in the sales cycle.
- Data-Driven Decision: By analyzing the high revenue month (June), you can replicate any strategies or promotions that contributed to that spike. Alternatively, if some months underperform, consider running targeted campaigns or adjusting inventory during those months to boost sales.
Order Status (Current Month):
- Description: This pie chart shows that all orders in the current month have been marked as Completed, indicating high fulfillment efficiency.
- Benefit: Tracking order status allows you to gauge how effectively orders are processed and fulfilled. A completed order status signals smooth operations.
- Data-Driven Decision: If the completion rate were low, it would indicate potential issues in order processing, fulfillment, or customer service. In that case, a review of your operations, such as improving supply chain processes or enhancing customer support, might be necessary.
Daily Revenue :
- Description: These two charts provide a detailed view of daily revenue in both 2025 and 2024, with color coding showing different revenue ranges (e.g., $0 – $10, $11 – $100, etc.).
- Benefit: Analyzing daily revenue trends gives insight into specific days when revenue is higher or lower. It can show patterns that can inform strategic decisions on marketing, inventory, or staffing.
- Data-Driven Decision: If the data reveals consistent high revenue on certain days, you can align marketing efforts (e.g., flash sales, product promotions) to capitalize on these high-performing days. For example, if weekends or specific holidays drive more sales, ensure your promotional efforts are aligned with these spikes to maximize revenue.
Customer Daily Revenue
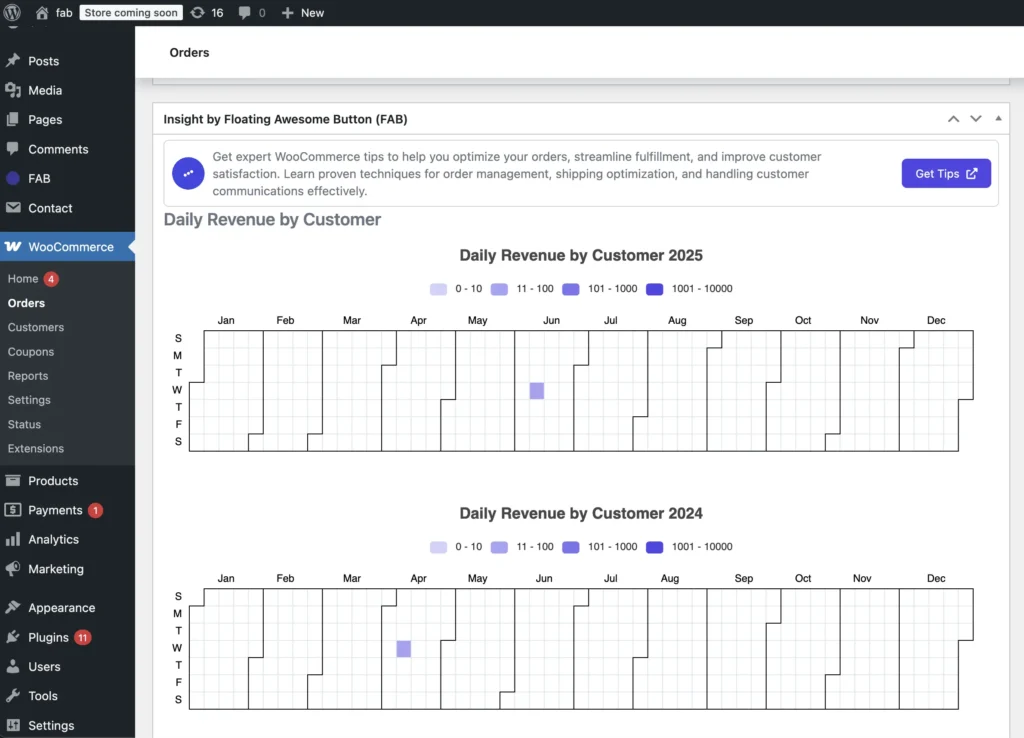
To gain deeper insights into your customers’ buying patterns, simply visit your WooCommerce orders page. There, you’ll find a Daily Revenue chart specifically tailored to each customer. This valuable data allows you to:
- Targeted Marketing: If you notice higher revenue from customers spending over $1000 during specific months or days, you can create targeted campaigns to attract similar high-value customers.
- Optimizing Promotions: If the chart shows that certain days have higher revenue from low-spending customers (under $10), you could tailor discount strategies to encourage these customers to spend more.
- Improving Customer Retention: The chart also gives insights into the spending behavior of different customers over time. By identifying which customers tend to spend larger amounts and during what periods, you can adjust your retention efforts (e.g., special offers or VIP discounts) to increase customer loyalty.
Conclusion: Your Data, Your Growth Story
WooCommerce Analytics is more than just a collection of numbers; it is a powerful narrative of a store’s performance, customer behavior, and market opportunities. By embracing these analytical tools, business owners can move beyond guesswork and make truly informed decisions. The ability to track key metrics, analyze trends, and understand the interconnectedness of various business facets empowers them to refine marketing campaigns, optimize product offerings, streamline inventory, and ultimately, significantly increase revenue.
The insights gained from WooCommerce Analytics, when coupled with practical tools like the “Floating Awesome Button,” create a dynamic system for continuous improvement. The analytics reveal what needs to be done, and the plugin provides the means to do it effectively, enhancing user engagement and conversion rates. This synergy allows businesses to improve customer retention, optimize operations, and gain a competitive edge in the bustling online marketplace. By consistently leveraging data, any WooCommerce store can write its own success story, driven by knowledge and strategic action.
Resource
- WooCommerce Documentation